| <Python (Object Oriented Programming)>
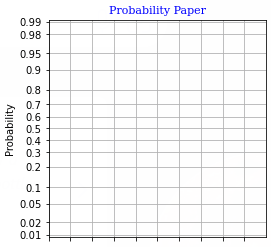
[Main] code2.2ccc_grid.py
import matplotlib
import matplotlib.pyplot as plt
import numpy as np
#import numpy.random as rnd
import hwblines2 as hl
#import statpos as sp

eps = 0.01
xmin = 0.
xmax = 10.
xstep = 1.

ax = plt.axes()
ax.set_xlim(xmin, xmax)
ax.set_ylim(0.0, 1.0)
ax.set_aspect(xmax-xmin)

xtic = np.arange(xmin, xmax, xstep)
xlabels = np.array(['', '', '', '', '', '', '', '', '', ''])
ax.set_xticks(xtic)
ax.set_xticklabels(xlabels)
ax.set_xlabel('')

yax = hl.tic_label(eps)
ax.set_yticks(yax.tics)
ax.set_yticklabels(yax.labels)
ax.set_ylabel('Probability')

ax.grid(True)
font1 = {'family':'serif','color':'blue','size':11}
#font2 = {'family':'serif','color':'darkred','size':12}
plt.title("Probability Paper", fontdict = font1)

plt.show()
[Module] hwblines.py
import numpy as np
import hwbfiles as hf
from scipy.special import erfinv

class tic_label:

    def __init__(self, eps):
        feps = erfinv(1.0 - 2.0*eps)

        def finvcumulat(y):
            z = (1.0 - 2.0*eps)*erfinv(1.0 - 2.0*y)/feps
            return 0.5*(1.0 - z)

        p = np.array([eps, 0.02, 0.05, 0.1, 0.2, 0.3, 0.4, 0.5,\
            0.6, 0.7, 0.8, 0.9, 0.95, 0.98, 1.0-eps])
        s = str(eps)
        ss = str(1.0 - eps)
        q = np.array([s,'0.02','0.05','0.1','0.2','0.3','0.4',\
            '0.5','0.6','0.7','0.8','0.9','0.95','0.98',ss])
        nticks = 15
        r = np.arange(0.0, float(nticks), 1.0)

        for i in range(nticks):
#            print(p[i])
            r[i] = finvcumulat(p[i])

        self.tics = r
        self.labels = q
        self.nticks = nticks
        self.finvcumulat = finvcumulat

    def info(self):
        print("Information on class 'tic_label'")
        print('nticks:',self.nticks)
        print('labels:',self.labels)
        print('tick position:')
        for i in range(self.nticks):
            print(f"{self.tics[i]:,.3f}",end=" ")
        print()
|
<Modula-2 (Structured Programming)>
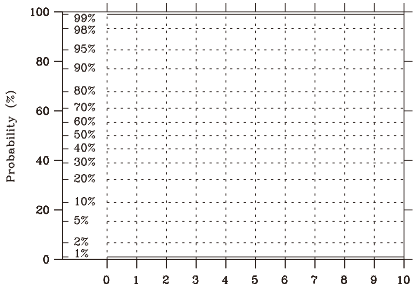
[MAIN] MODULE cumulatPlot.MOD
FROM cumulative IMPORT gridPlot,・・・
FROM HgrWindows IMPORT openTextWin,initXDSgraph,・・・
FROM IO IMPORT WrStr, WrLn, ・・・
・・・
BEGIN
  openTextWin(W1,'Graphic Application');
  initXDSgraph(_big);

  ticscale:= _Berendsen;
  setBerendsenCoeff(0.01);

  cXmn:= -1.5; cXst:= 0.0; cXmx:= 10.0; cXsp:= 1.0;
  ticX.barleft:= cXmn;

  setTicPos(ticscale);
  scalePos();
  whereXtic(ticX);

  gridPlot(ticcumn,ticpos,Ntic,avrev, 0);
  WrLn;
  WrStr(' Want to generate a plotter file? (y/n)>');
  IF CAP(WinAuxIO.GetKey())='Y' THEN
    gridPlot(ticcumn,ticpos,Ntic,avrev, 2);
  END;
  ・・・
[MODULE] cumulative
DEFINITION MODULE cumulative;

PROCEDURE gridPlot(VAR ticcumn: ARRAY OF LONGREAL;
		            VAR ticpos: ARRAY OF LONGREAL;
		                  Ntic: INTEGER;
		              scalePos: LONGREAL;
		  	               dev: INTEGER);
・・・・・・
IMPLEMENTATION MODULE cumulative;
FROM SpecFunc IMPORT invErf,・・・
FROM HgrGlobal IMPORT graphsize,・・・
FROM HgrProtoType IMPORT LinLinFrame,・・・
FROM HgrLine IMPORT polyline,・・・
IMPORT HgrLow;
IMPORT HgrStrings;
IMPORT WinAuxLib, WinAuxIO, WinAuxStr;
FROM WinAuxIO IMPORT GetKey, CheckLngRealValue, hitKey;
FROM IO IMPORT WrStr, WrInt, WrLn, WrLngReal;
IMPORT Str;

PROCEDURE funBerendsen(y: LONGREAL): LONGREAL;
  VAR
    zy: LONGREAL;
  BEGIN
    IF y<=0.0 THEN
      WrStr(' set to 0 to avoid overflow'); WrLn; zy:= 0.0;
    ELSIF y>=1.0 THEN
      WrStr(' set to 1 to avoid overflow'); WrLn; zy:= 1.0;
    ELSE
      zy:= cA_Berendsen * invErf(2.0*y - 1.0) + 0.5;
    END;
    RETURN zy;
  END funBerendsen;

PROCEDURE gridPlot(VAR ticcumn: ARRAY OF LONGREAL;
		      VAR ticpos: ARRAY OF LONGREAL;
		            Ntic: INTEGER;
		        scalePos: LONGREAL;
		  	         dev: INTEGER);
  CONST
    TitleSize=4; Size=4; black=15; green=2; c1=13; c2=12;
    Xlabl = "4.0"; Ylabl = "4.0";
    Ymn  = 0.0; Ymx  = 100.0;
    Xstep= 1.0; Ystep= 50.0;
    eps = 1.0E-8;
  VAR
    i, ii    : INTEGER;
    ix, iy   : INTEGER;
    col1,col2: INTEGER;
    xtit,ytit: ARRAY [0..31] OF CHAR;
    u, v : ARRAY[0..1] OF REAL;
    OK  : BOOLEAN;
    str : ARRAY [0..15] OF CHAR;

  BEGIN
    isRectangle:= isRect;
    IF dev=0 THEN col1:= c1; col2:= c2; ELSE col1:=1; col2:= 1;
    END;
    Str.Copy(xtit, 0C);
    Str.Copy(ytit,'Probability (%)');
    Str.Copy(LabelLrLtX, Xlabl);
    Str.Copy(LabelLrLtY, Ylabl);

    FOR i:=0 TO Ntic-1 DO
        ticpos[i]:= funBerendsen(ticcumn[i]);
        out("tic y-posn", i, ticpos[i]);
    END;

    iniplt(dev, 1.0);
    TicPosition(FALSE); (* ticks out of frame *)
    LinLinFrame(cXmn, cXst, cXmx, cXsp, cYmn, cYmn, cYmx, cYsp,
                  0, 0, 0, 0, Size, xtit, ytit, FALSE, 1.0);

    FOR i:=0 TO Ntic-1 DO
      IF (i=0) THEN
        u[0]:= ticX.barleft;
        u[1]:= ticX.barright;
        v[0]:= 100.0*FLOAT(ticpos[i]); v[1]:= v[0];
        polyline(u, v, 2, col3, 0, Size, 0, 0);

        u[0]:= cXst; u[1]:= cXmx;
	    polyline(u, v, 2, col3, 0, Size, 0, 0);

      ELSIF (i=Ntic-1) THEN
        u[0]:= ticX.barleft;
        u[1]:= ticX.barright;
        v[0]:= 100.0*FLOAT(ticpos[i]); v[1]:= v[0];
        polyline(u, v, 2, col3, 0, Size, 0, 0);

        u[0]:= cXst; u[1]:= cXmx;
	    polyline(u, v, 2, col3, 0, Size, 0, 0);
      ELSE
        u[0]:= ticX.barleft;
        u[1]:= ticX.barright;
        v[0]:= 100.0*FLOAT(ticpos[i]); v[1]:= v[0];
        polyline(u, v, 2, col3, 0, Size, 0, 0);

        u[0]:= cXst; u[1]:= cXmx;
        polyline(u, v, 2, col3, 0, Size, 0, 2);
      END;

      ix:= HgrLow.iscrx(ticX.label + ushift);
      iy:= HgrLow.iscry(v[0] + vshift);

      Str.Append(str,'%');
      HgrStrings.justifystring(ix,iy, str, 0, chsize, base,base);
    END;

    u[0]:= cXst; u[1]:= u[0]; v[0]:= cYmn; v[1]:= cYmx;
    LOOP
      polyline(u, v, 2, col3, 0, Size, 0, 2);
      u[0]:= u[0] + cXsp;
      IF u[0]>= cXmx THEN EXIT END;
        u[1]:= u[0];
    END;

    IF dev=2 THEN endplt END;
  END gridPlot;
  ・・・・・・
|