| Updating Python Code 2.2 (p.171) for Figure 2.3 (p.8) | |
|
<Revised code2.2.py>
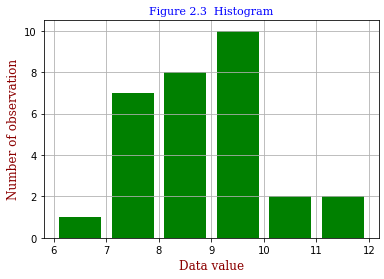
Let us express in histograms the cumulative data obtained in Part (2). The revised code2.2.py reads 30 experimental data xi (i=1..N) from the csv file (contents), defines the array binsi, and invokes hist, giving the output in the right. Dr. Berendsen originally wrote the following code.
|
<Graphics output from the revised code>
|