| Updating Python Code 2.5 (p.172) for Figure 2.7 (p.16) | |
|
<code2.5.py>
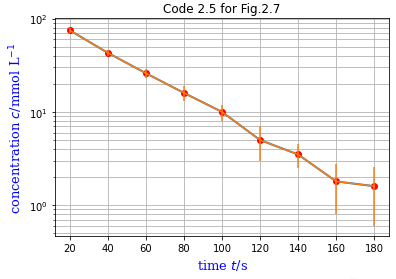
The time-dependent changes in concentration are represented by a logarithmic graph with errors. What follows is the original code by Dr. Berendsen.
|
<Graphics output from the revised code>
|
|
<Revised code2.5.py> In many laboratories it is likely that data are changed but programs remain unchanged. Thus the revised code2.5.py reads csv files (contents). The first line of the csv file is a headling, comprising 3 items corresponding to i, x, y. If an item begins with a letter i, the data of that column are understood as integers. |
<The module hwbfiles.py> readData(file_name,check) of hwbfiles.py is invoked to read file. Part of the test program is shown below.
|